print("hello woRld")[1] "hello woRld"my_apples <- 4
my_apples[1] 4my_apples - 1[1] 3My_applesError:
! object 'My_apples' not foundn_apples <- c(7, my_apples, 13)
my_apples[1] 4my_apples <- my_apples - 1
n_apples[1] 7 4 13Hello
Private Sub Form_Load() MsgBox "Hello, World!" End Sub
Hallo
مرحبا
print('Hello world')
नमस्ते & السلام عليكم
print("Hello world")
<html> Hello world</html>
¡Hola!
سلام
In groups three or four meet and greet each other. You may consider sharing
Your name
Your year
I live …
What excites me about this quarter is …
One academic strength you have
One personal strength you have
The most important thing about this course:
Make sure to bookmark it.
Think 💭 - Pair 👫🏽 - Share 💬
What do you think data science is about and what will we learn in this course? There is no right or wrong answer.
Data science is an interdisciplinary academic field that uses statistics, scientific computing, scientific methods, processes, algorithms and systems to extract or extrapolate knowledge and insights from noisy, structured, and unstructured data. Wikipedia
Data science also integrates domain knowledge from the underlying application domain (e.g., natural sciences, information technology, and medicine). Data science is multifaceted and can be described as a science, a research paradigm, a research method, a discipline, a workflow, and a profession. Wikipedia
What types of data will we use in this course
We will use a variety of datasets from biological studies to business answering questions serving different purposes in life. Data will come different size, shape, and form and will include numbers, categories, text etc.
Is this a statistics course or a computing course?
A little bit of both.
Do I need prior programming/statistics experience?
No
Code from this video is provided on the next few slides.
Keyboard Shortcut
Windows: Alt + -
Mac: Option + -
If something comes in quotes, it is not defined in R. Later in the quarter we will call these as characters. More on that later.
do() is a function;
something is the argument of the function.
In order to get any help we can use ? followed by function (or object) name.
Tip
You should not copy paste code from my slides or from the internet. Part of learning to code is building up your muscle memory.
canyoureadthissentence?
After function names do not leave any spaces.
Before and after operators (e.g. <-, =) leave spaces.
Put a space after a comma, not before.
Object names are all lower case, with words separated by an underscore.
Tip
You can let RStudio do the indentation for your code.
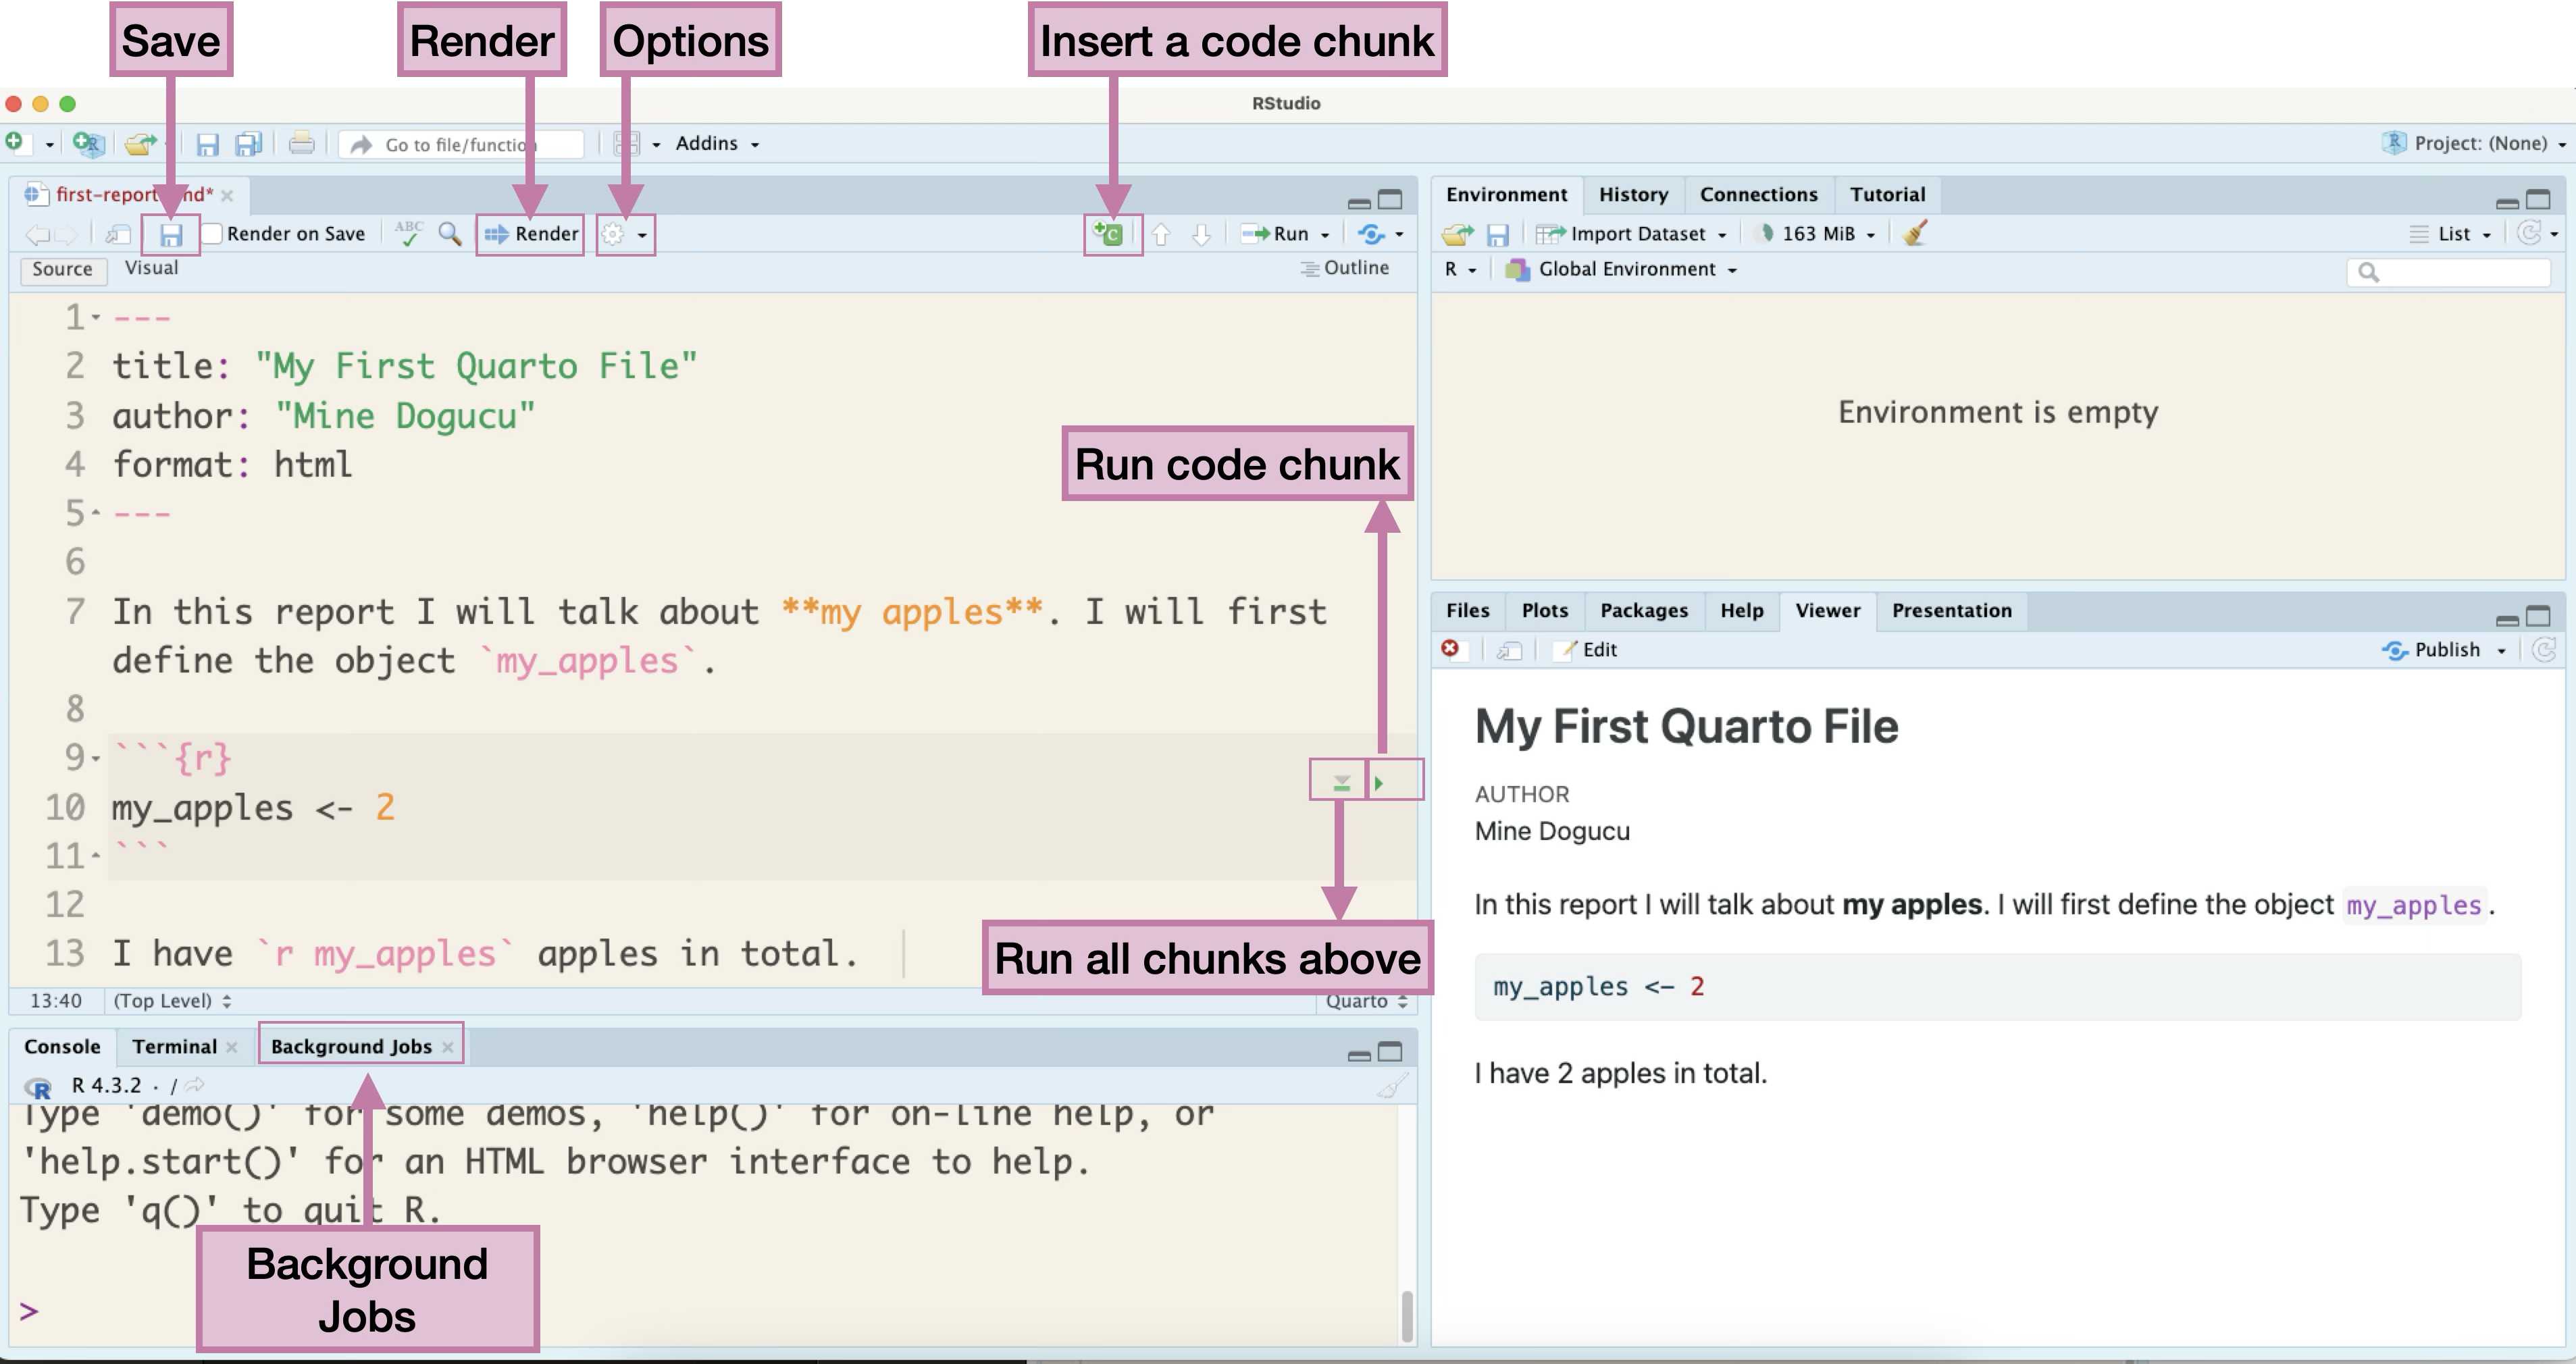
The file I create in the video similar to the my-first-report.qmd file provided here.
markdown is a markup language. Markup languages instruct software on how to display or interpret text and data. We use markdown within a Quarto document.
_Hello world_

__Hello world__

~~Hello world~~
Hello world
Hello world
Hello world
Quarto source file can be accessed here my-first-report.qmd.
Slides that you are currently looking at are also written in Quarto. You can take a look at them on our course’s GitHub organization in the slides repo.
When you buy a new phone it comes with some apps pre-installed.
If you want to use a different app you can install it.
When you download R for the first time to your computer. It comes with some packages already installed. You can also install many other R packages.
What do R packages have? All sorts of things but mainly
functions
datasets
Try running the following code:
Why are we seeing this error?
In your Console, install the beepr package
We do this in the Console because we only need to do it once. If we add this code in Quarto, we will be installing the package again and again each time we render the document.
Option 1
More common usage.
Useful if you are going to use multiple functions from the same package. E.g. we have used many functions (ggplot, aes, geom_…) from the ggplot2 package. In such cases, usual practice is to put the library name in the first R chunk in the .qmd file.
Option 2
Useful when you are going to use a function once or few times. Also useful if there are any conflicts. For instance if there is some other package in your environment that has a beep() function that prints the word beep, you would want to distinguish the beep function from the beepr package and the beep function from the other imaginary package.
Running ?beep in the Console opens the Help pane with the package documentation. We run this in the Console and not in Quarto so that we won’t get the help every time we render the Quarto document.
beep {beepr} - indicates that the beep package is in the beepr package
Pay attention to parts of documentation: Description, Usage, Arguments, Details, Examples. At your stage Examples are a great resource.
beep(sound = 1, expr = NULL) indicates that the default sound is set to be 1.
Pay attention to argument options.
This should play the mariokart sound.
Any one around the world can create R packages.
Good part: We are able to do pretty much anything R because someone from around the world has developed the package and shared it.
Bad part: The language can be inconsistent.
Good news: We have tidyverse.
The tidyverse is an opinionated collection of R packages designed for data science. All packages share an underlying design philosophy, grammar, and data structures. tidyverse.org
In short, tidyverse is a family of packages. From practical stand point, you can install many tidyverse packages at once (and you did this).
We can also load multiple tidyverse packages all at the same time.
── Attaching core tidyverse packages ──────────────────────── tidyverse 2.0.0 ──
✔ dplyr     1.2.1     ✔ readr     2.2.0
✔ forcats   1.0.1     ✔ stringr   1.6.0
✔ ggplot2   4.0.2     ✔ tibble    3.3.1
✔ lubridate 1.9.5     ✔ tidyr     1.3.2
✔ purrr     1.2.2
── Conflicts ────────────────────────────────────────── tidyverse_conflicts() ──
✖ dplyr::filter() masks stats::filter()
✖ dplyr::lag()    masks stats::lag()
ℹ Use the conflicted package (<http://conflicted.r-lib.org/>) to force all conflicts to become errorsDoes this look familiar?
hw1
hw1_final
hw1_final2
hw1_final3
hw1_finalwithfinalimages
hw1_finalestfinal
What if we tracked our file with better names for each version and have only 1 file hw1?
hw1 added questions 1 through 5
hw1 changed question 1 image
hw1 fixed typos
We will call the descriptions in italic commit messages.
git allows us to keep track of different versions of a file(s).
GitHub is a website where we can store (and share) different versions of the files.
Tip
Always use .Rproj file to open projects. Then open the appropriate .qmd / .R file from the Files pane. If you don’t open .Rproj file you will not be able to see the Git pane.
repo is a short form of repository. Repositories contain all of your project’s files as well as each file’s revision history.
For this course our weekly repos (lecture code, activity etc.) are hosted on Github.
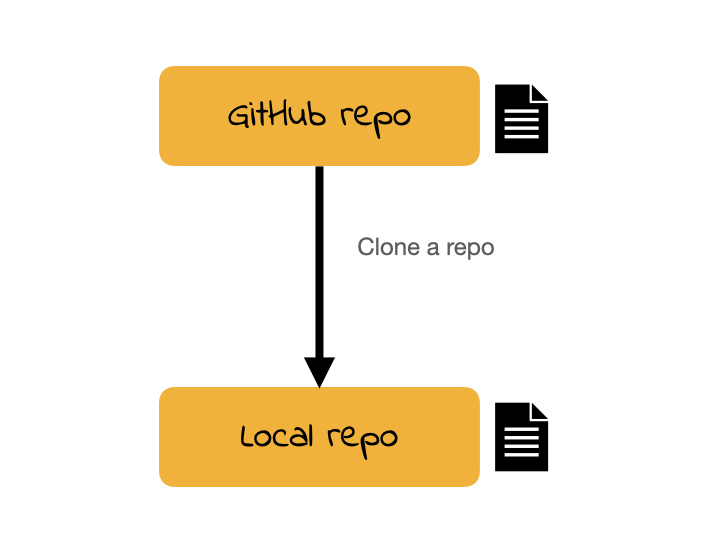
To clone a GitHub repo to our computer, we first copy the cloning link as shown in screencast then start an RStudio project using that link.
Cloning a repo pulls (downloads) all the elements of a repo available at that specific time.
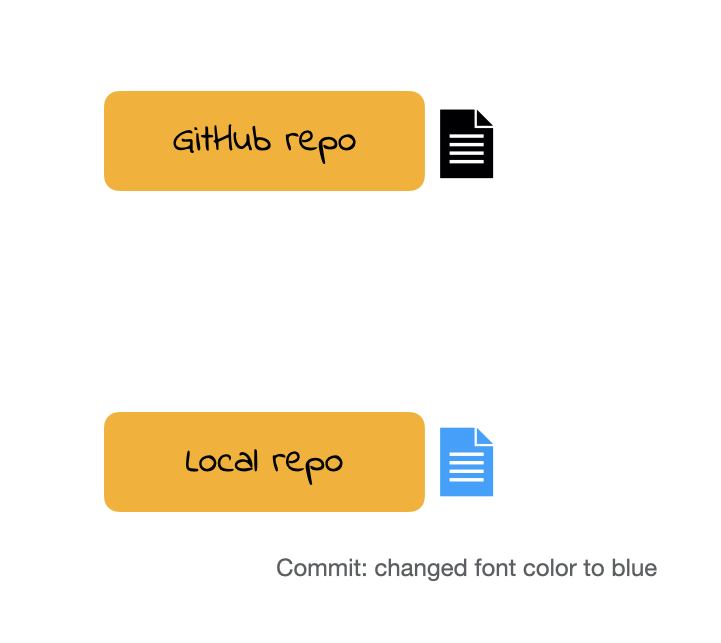
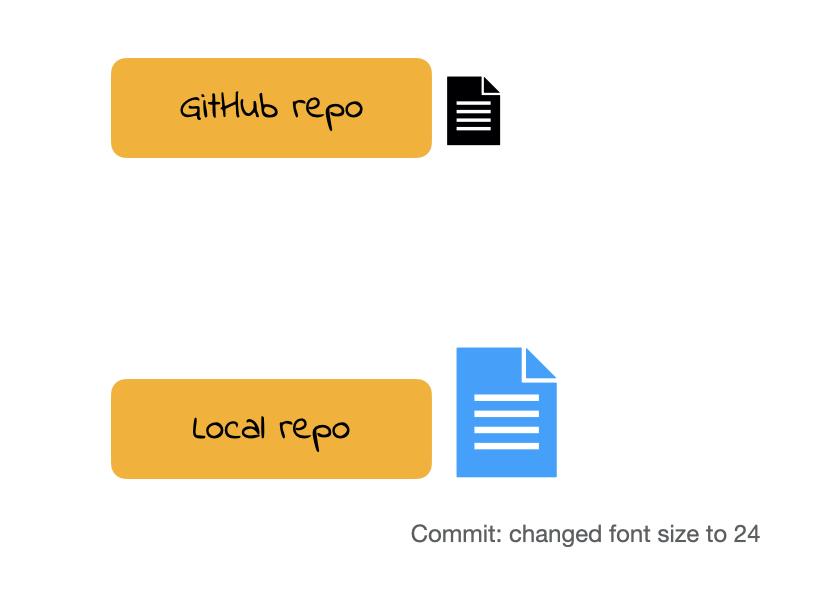
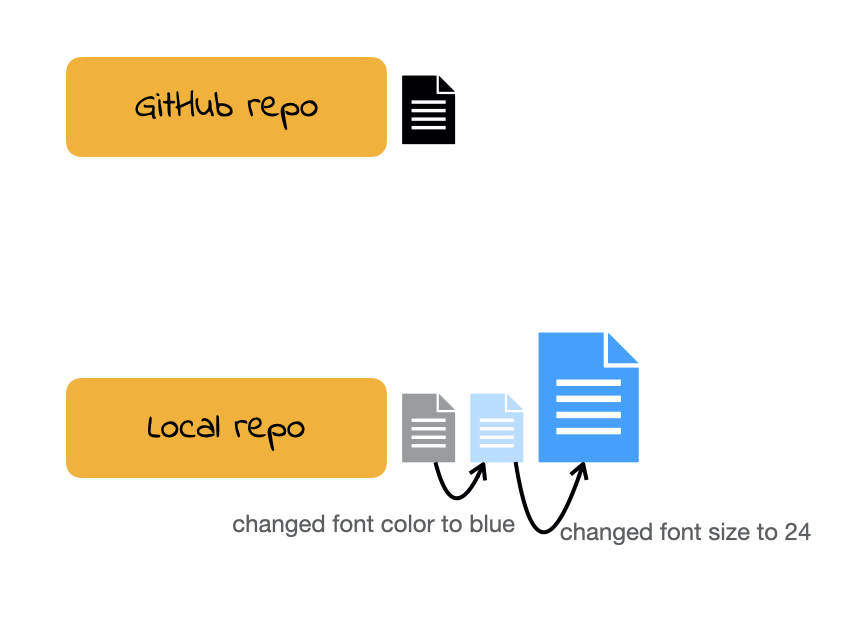
Once you make changes to your repo (e.g. take notes during lecture, answer an activity question) you can take a snapshot of your changes with a commit.
This way if you ever have to go back in version history you have your older commits to get back to.
This is especially useful, for instance, if you want to go back to an earlier solution you have committed.
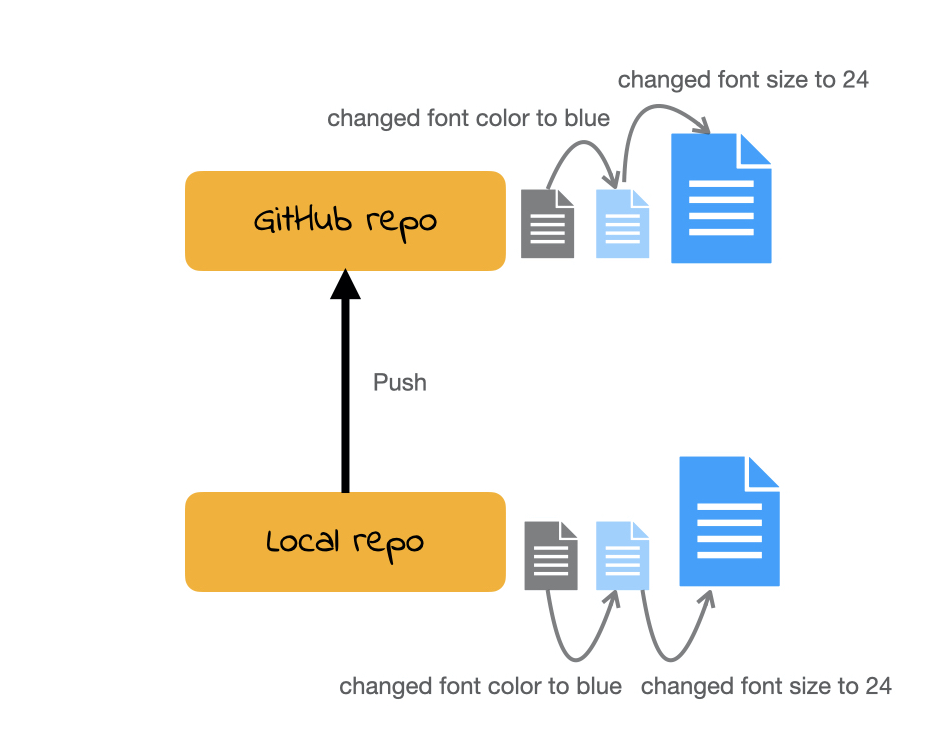
All the commits you make will initially be local (i.e. on your own computer).
In order for us to see your commits and your final submission on any file, you have to push your commits. In other words upload your files at the stage in that specific time.
Git: is software for tracking changes in any set of files
GitHub: is an internet host for Git projects.
repo: is a short form of repository. Repositories contain all of your project’s files as well as each file’s revision history.
clone: Cloning a repo pulls (downloads) all the elements of a repo available at that specific time.
commit: A snapshot of your repo at a specific point in time. We distinguish each commit with a commit message.
push: Uploads the latest “committed” state of your repo to GitHub.